
Bitcoin Bull Run Phase Tracker
Current Cycle Analysis
This tool helps you determine which phase of the Bitcoin bull run cycle you're currently in based on key market indicators.
Bull Run Cycle Phases
How This Cycle Compares
Current cycle shows ... Bitcoin dominance. Historical cycle averages: Accumulation: 30-45%, Growth: 45-60%, Bubble: 60-70%, Crash: 45-50%
ETF inflows are currently ... compared to historical peaks. During the 2021 bubble, daily inflows reached 1,200 BTC.
Bitcoin doesn’t just go up and down-it follows a rhythm. Since 2009, it’s had four major bull runs, each triggered by a Bitcoin halving and shaped by different forces: early adopters, ICO mania, institutional money, and now ETFs. These aren’t random spikes. They’re predictable cycles, repeating roughly every four years, with similar phases, emotional patterns, and price behaviors. If you want to understand where Bitcoin might be headed next, you need to look at what happened before.
What Is a Bitcoin Bull Run?
A Bitcoin bull run is a sustained, explosive rise in price, usually lasting 12 to 18 months, that follows a period of consolidation after a halving. It’s not just about price going up-it’s about adoption, sentiment, and capital shifting into Bitcoin at scale. These runs end in a bubble phase, where hype peaks and prices become detached from fundamentals, followed by a sharp correction-often 75% or more.The 2013 Bull Run: The First Real Test
Bitcoin’s first major bull run started in early 2013. It was trading around $145 in May. By December, it hit $1,200. That’s a 730% surge in just seven months. What caused it? The Cyprus banking crisis. People saw their bank accounts frozen and started looking for alternatives. Bitcoin, still new and obscure, became a quiet escape hatch. This cycle was raw. There were no ETFs, no institutional wallets, no Coinbase app on your phone. Most trading happened on Mt. Gox, which handled over 70% of all Bitcoin transactions at the time. When Mt. Gox collapsed in early 2014, prices crashed to under $300. Many early investors lost everything. But those who held through the crash saw Bitcoin recover and eventually go on to bigger things.The 2017 Bull Run: The ICO Boom and Retail Frenzy
By 2017, Bitcoin had a story. It wasn’t just a digital cash experiment anymore-it was a financial revolution. The price started at $1,000 in January and exploded to $20,000 by December. That’s a 1,900% gain. This time, the driver wasn’t just fear of banks. It was greed. The ICO boom flooded the market with new crypto projects. Ethereum was rising. Altcoins like Ripple and Litecoin got their own hype. Retail investors poured in. Reddit threads exploded. Twitter was full of “to the moon” memes. Coinbase struggled to keep up with sign-ups. Trustpilot reviews from Q4 2017 show users praising the platform-but also complaining about crashes during peak trading hours. The crash that followed was brutal. Bitcoin dropped from $20,000 to under $200 by late 2015. Wait-that’s not right. The correction actually took until late 2018 to bottom out near $3,200. The bear market lasted over two years. Many who bought at the peak lost 85% of their money. But those who held? They waited for the next cycle.The 2020-2021 Bull Run: Institutional Entry
The 2020 halving happened during a global pandemic. Central banks printed trillions. Inflation fears spiked. Bitcoin’s fixed supply looked like a hedge. This time, institutions showed up. Tesla bought $1.5 billion worth. MicroStrategy bought over 100,000 BTC. Grayscale’s Bitcoin Trust became the biggest way for Wall Street to get exposure. By November 2021, Bitcoin hit $69,000. That’s a 762% gain from the $8,000 starting point after the halving. The market was bigger, smarter, and more connected. Social media volume hit 1.2 million mentions per day on Twitter. Reddit’s r/Bitcoin had over 1.5 million members. But the same emotions were there: FOMO, panic selling, and regret. One Reddit user wrote in January 2018: “I sold at $12,000 thinking it was the top. Watched it hit $20,000. I missed it.” That story repeats every cycle. The correction? It was deep. By November 2022, Bitcoin fell to $15,476-a 77.7% drop from its peak. But this time, the bottom held stronger. Institutions didn’t flee. They bought the dip.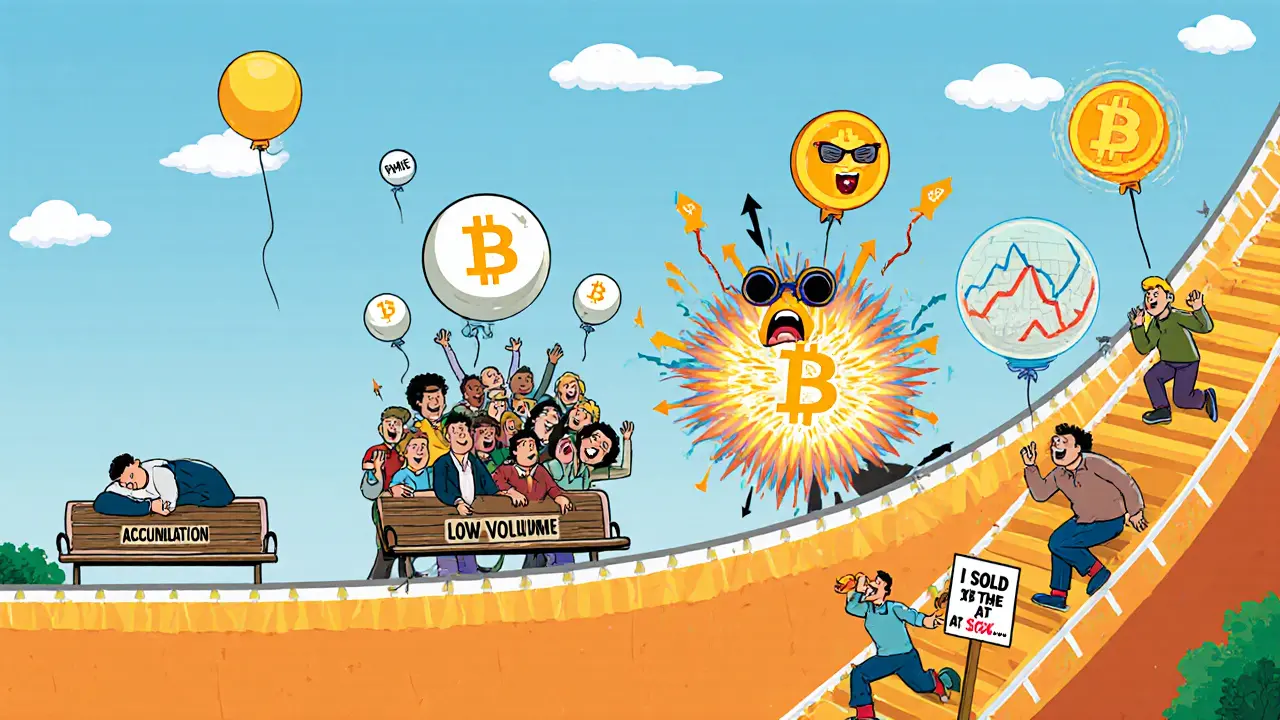
The 2024 Cycle: ETFs, Regulation, and a New Era
The April 20, 2024 halving was different. This time, the catalyst wasn’t just supply shock-it was approval of spot Bitcoin ETFs in the U.S. BlackRock, Fidelity, and Ark launched ETFs that let traditional investors buy Bitcoin like a stock. By November 2024, these ETFs had accumulated over 850,000 BTC-worth about $50 billion. Bitcoin dominance-the percentage of total crypto market cap held by Bitcoin-rose to 58%. That’s a sign capital is rotating from altcoins back to Bitcoin, just like in 2017 and 2021. Exchange reserves are falling. Hash rate is hitting new all-time highs. The market is no longer driven by memes or ICOs. It’s driven by balance sheets and compliance. Analysts at Standard Chartered predict a peak between $180,000 and $200,000 by late 2025 or early 2026. ARK Invest is more conservative, forecasting $150,000 by 2030. But one thing is clear: this cycle has more infrastructure than any before it. Custody solutions, regulated exchanges, and institutional-grade trading tools make the market more stable-even if it still swings wildly.The Four Phases of Every Bitcoin Bull Run
Every bull run follows the same four stages:- Accumulation (Phase 1): Prices hover near the bottom. Volume is low. Sentiment is negative. This is when smart money buys quietly. It lasts 6-12 months after the halving.
- Growth (Phase 2): Prices start climbing steadily. Media picks up the story. Retail investors begin to notice. Bitcoin dominance rises as altcoins stall. This is the longest phase.
- Bubble (Phase 3): Prices shoot up exponentially. Fear & Greed Index hits “Extreme Greed.” Everyone knows someone who made money. Social media explodes. This is when you hear “Bitcoin will hit $1 million.”
- Crash (Phase 4): The top is reached. Then it falls fast-75% to 80% is typical. Panic selling. FUD spreads. But this is also when the next accumulation phase begins.
What to Watch Right Now
If you’re trying to figure out where we are in the 2024 cycle, here are the key signals:- Bitcoin dominance: Rising? That means money is flowing into Bitcoin, not altcoins. That’s a growth phase signal.
- Exchange reserves: If Bitcoin is leaving exchanges and going into cold wallets, it’s a sign holders are not planning to sell.
- Hash rate: If miners are investing more in hardware, they believe in long-term value.
- ETF inflows: Daily inflows into U.S. spot ETFs are a real-time indicator of institutional demand.
- Fear & Greed Index: If it hits “Extreme Greed” (above 80), you’re likely near the top.
Why This Time Might Be Different
Yes, the pattern repeats. But the players have changed. In 2013, it was hobbyists. In 2017, it was retail traders. In 2021, it was hedge funds. Now, it’s pension funds, endowments, and sovereign wealth funds. The market cap has grown from $15 billion in 2013 to $3 trillion in 2021. Today, it’s over $1.2 trillion-and growing. Regulation is clearer. MiCA in Europe, ETFs in the U.S., and better custody mean less risk of catastrophic exchange failures. Bitcoin isn’t just a speculative asset anymore. It’s becoming a reserve asset. Countries like El Salvador have adopted it as legal tender. Companies use it for treasury reserves. Even central banks are studying digital gold as a hedge.What to Do If You’re New
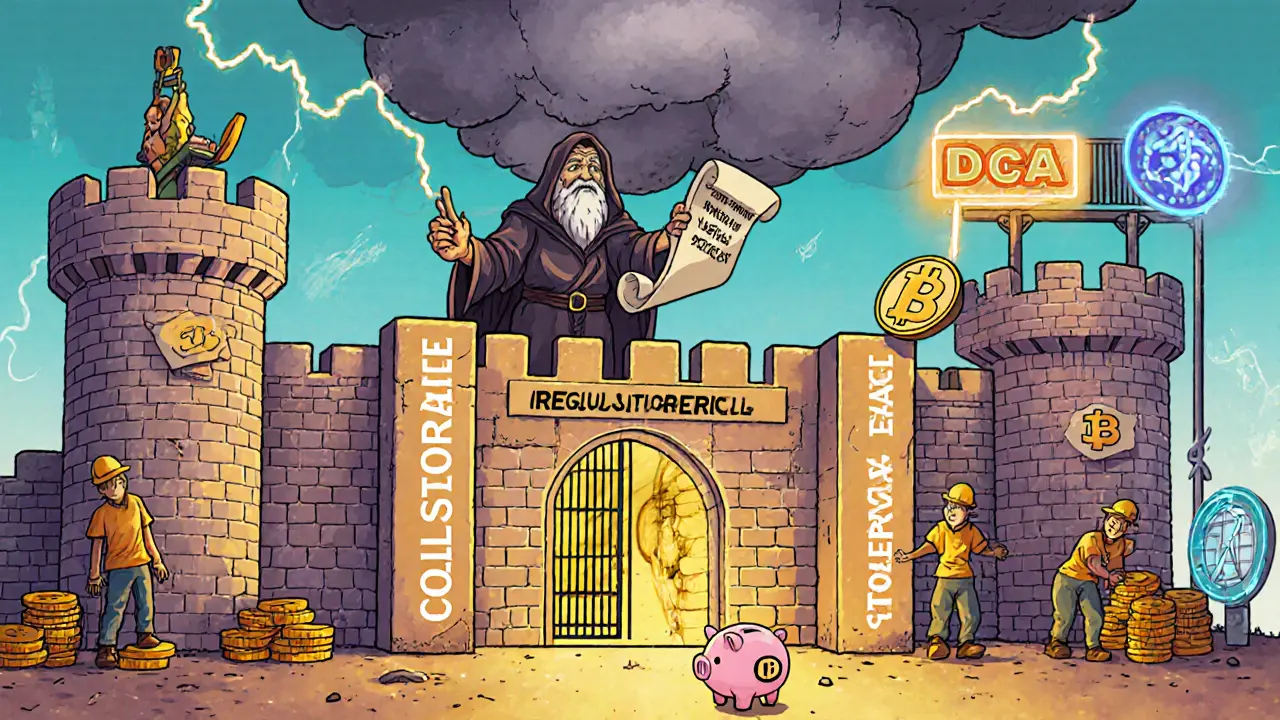
Don’t try to time the top. You won’t. Even experts get it wrong. Instead:- Use dollar-cost averaging. Buy a little every week, no matter the price.
- Keep 80% of your Bitcoin in cold storage. Don’t leave it on exchanges.
- Ignore the noise. Reddit and Twitter are emotional amplifiers, not investment guides.
- Study the cycles. Read the data. Know what phase you’re in.
- Remember: the biggest gains come from holding through the crash.
What’s Next?
The next 12-18 months will determine if the 2024 cycle matches the explosive growth of 2017 or the institutional-driven surge of 2021. If ETF inflows keep rising and Bitcoin dominance stays above 55%, we could see $150,000-$200,000 by early 2026. But history also warns us: when everyone is bullish, it’s time to be cautious. The next crash will come. The question isn’t if-it’s when. And how you prepare will decide whether you lose everything or build real wealth.How often do Bitcoin bull runs happen?
Bitcoin bull runs typically occur every four years, right after the halving event when miner rewards are cut in half. This pattern has held for all four cycles since 2012, with each cycle lasting 12 to 24 months from the halving to the peak. The next halving is expected in 2028.
What caused Bitcoin to rise in each bull run?
Each cycle had different drivers: 2013 was triggered by the Cyprus banking crisis and early adoption; 2017 was fueled by ICOs and retail FOMO; 2020-2021 saw institutional adoption from companies like Tesla and MicroStrategy; and 2024-2025 is being driven by spot Bitcoin ETFs and regulated institutional access.
How deep do Bitcoin corrections usually go?
Historically, Bitcoin corrections after a bull run peak drop between 75% and 80% from the top. The 2013 peak fell 75%, the 2017 peak fell 83%, and the 2021 peak fell 77.7%. These drops take months or even years to recover from, but the long-term trend has always been upward.
Is now a good time to buy Bitcoin?
There’s no perfect time to buy Bitcoin. The best strategy is dollar-cost averaging-buying small amounts regularly over time. Trying to time the bottom or top almost always leads to regret. Focus on holding long-term and ignore short-term noise.
What’s the biggest risk in the current bull run?
The biggest risks are macroeconomic shocks-like a global recession or rising interest rates-and regulatory crackdowns in key markets like the U.S. or EU. While institutional infrastructure is stronger than ever, Bitcoin’s price is still tied to global risk sentiment.
Can Bitcoin reach $1 million?
It’s possible, but not guaranteed. If Bitcoin becomes a global reserve asset and adoption continues at its current pace, models suggest it could reach $1 million by 2030-2035. That would require widespread institutional use, central bank adoption, and regulatory clarity. Right now, $150,000-$200,000 is the more realistic near-term target.